For Enquire Call us : 9811631557
DIPLOMA IN DATA ANALYTICS WITH AI
Diploma in Data Analytics with AI
Build Data Analytics Skills with Artificial Intelligence
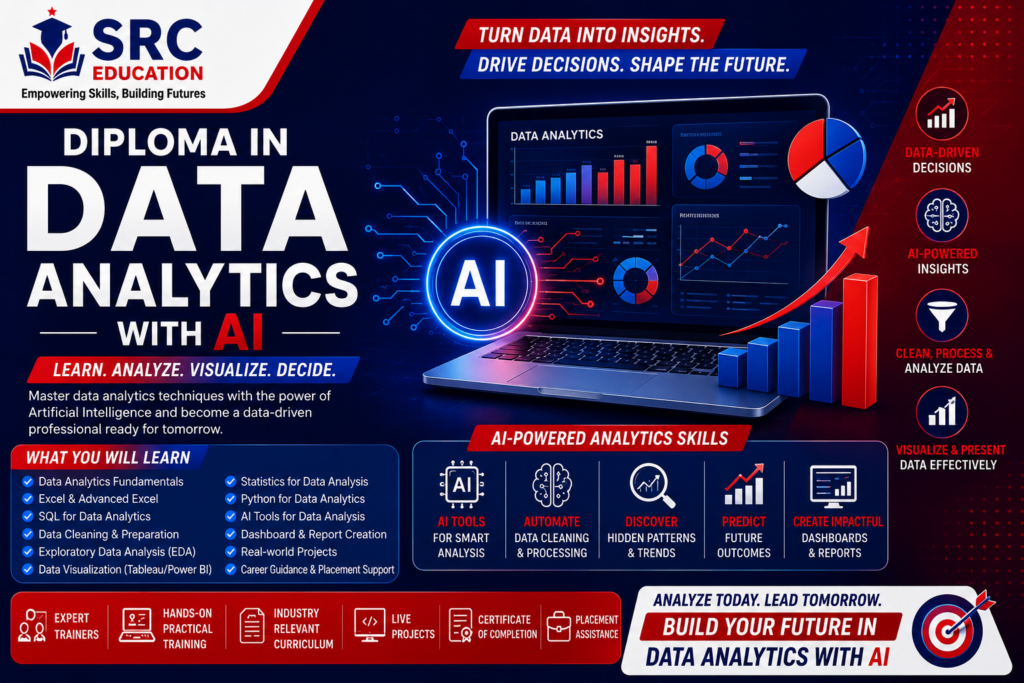
The Diploma in Data Analytics with AI is a career-focused professional program designed for students, graduates, working professionals, business owners, and individuals who want to build practical skills in data analysis and Artificial Intelligence.
Businesses generate large amounts of data every day. Customer information, sales records, website traffic, financial transactions, marketing performance, employee information, and operational data all contribute to business decision-making. However, raw data alone does not provide value unless it can be organized, analyzed, interpreted, and converted into useful insights.
Data Analytics helps organizations understand what is happening in their business, identify patterns, measure performance, discover opportunities, and make informed decisions.
Artificial Intelligence is further transforming the field by helping professionals process information, identify patterns, automate repetitive tasks, generate insights, and improve analytical workflows.
The Diploma in Data Analytics with AI combines fundamental data analytics concepts with modern AI applications to help learners understand how data can be transformed into meaningful business insights.
At SRC Education, the program is designed with a practical and career-oriented approach. Students can learn data handling, spreadsheets, databases, visualization, statistical concepts, business analytics, reporting, and AI-assisted analytical workflows.
What is Data Analytics with AI?
Data Analytics with AI combines traditional data analysis techniques with Artificial Intelligence tools and technologies.
Data Analytics involves collecting, cleaning, organizing, analyzing, and interpreting data. It helps businesses answer important questions such as:
- What products are selling the most?
- Which customers generate the most revenue?
- Which marketing campaign performs better?
- Why are sales increasing or decreasing?
- What trends can be identified from historical data?
- Which areas of the business need improvement?
- What factors influence customer behavior?
AI can support analysts by helping with tasks such as data exploration, pattern identification, summaries, forecasting assistance, automation, and insight generation.
The objective of this program is not simply to teach learners how to use software. It is designed to help them understand the complete analytical process—from raw data to meaningful business decisions.
Why Choose a Diploma in Data Analytics with AI?
Learn Practical Data Analytics
Students can develop practical knowledge of how data is collected, cleaned, analyzed, visualized, and presented.
Develop AI-Assisted Analytical Skills
Learners can understand how AI can support data exploration, analysis, reporting, and productivity.
Learn Industry-Relevant Tools
The program can introduce learners to commonly used data analytics tools and technologies.
Develop Business Intelligence Skills
Students learn how data can be converted into insights that support business decisions.
Build Visualization Skills
Charts, dashboards, and visual reports make complex information easier to understand.
Prepare for Data-Driven Careers
Organizations across industries increasingly depend on data to measure performance and make decisions.
Useful for Multiple Backgrounds
The course can be useful for students, graduates, professionals, entrepreneurs, and business users who want to understand data.
Who Should Join the Data Analytics with AI Course?
This course can be suitable for:
- Students interested in data analytics
- Graduates looking for career-oriented skills
- Working professionals
- Business professionals
- Marketing professionals
- Finance professionals
- Operations professionals
- Sales professionals
- HR professionals
- Entrepreneurs
- Business owners
- Individuals interested in data-driven decision-making
- Candidates interested in analytics careers
- Professionals who want to improve reporting skills
- Individuals interested in Artificial Intelligence
The exact eligibility requirements may vary according to the course structure and institute guidelines.
Course Curriculum
The Diploma in Data Analytics with AI covers the major concepts required to understand and work with data.
Module 1: Introduction to Data Analytics
Students begin by understanding the fundamentals of data and analytics.
Topics include:
- Introduction to data
- Types of data
- Structured and unstructured data
- Data analytics fundamentals
- Importance of data analytics
- Data-driven decision-making
- Data analytics lifecycle
- Business data
- Sources of data
- Descriptive analytics
- Diagnostic analytics
- Predictive analytics
- Prescriptive analytics
Students understand how organizations use data to improve business performance.
Module 2: Data Collection and Data Management
Before data can be analyzed, it needs to be collected and organized properly.
Students learn about:
- Data sources
- Data collection
- Data formats
- Data organization
- Data storage
- Data quality
- Data validation
- Data consistency
- Data documentation
- Basic data management
The module helps learners understand why clean and reliable data is important for accurate analysis.
Module 3: Microsoft Excel for Data Analytics
Excel is widely used for business reporting and data analysis.
Students learn how to use Excel for:
- Data entry
- Data organization
- Formatting
- Sorting
- Filtering
- Formulas
- Functions
- Conditional formatting
- Data validation
- Lookup functions
- Logical functions
- Text functions
- Date and time functions
- Pivot Tables
- Pivot Charts
- Data summaries
- Reporting
Students can use Excel to analyze business data and create professional reports.
Module 4: Advanced Excel for Analytics
Advanced Excel skills can help professionals work with larger and more complex datasets.
Topics include:
- Advanced formulas
- Lookup functions
- Logical functions
- Data cleaning
- Advanced filtering
- Pivot Tables
- Pivot Charts
- Data analysis
- Dynamic reporting
- Dashboard creation
- What-if analysis
- Data visualization
Students learn how to turn spreadsheet data into meaningful reports and dashboards.
Module 5: Data Cleaning and Preparation
Data often contains errors, duplicate records, missing values, inconsistent formats, and irrelevant information.
Data cleaning helps improve the quality of analysis.
Students learn:
- Identifying missing values
- Handling duplicates
- Correcting inconsistent formats
- Removing unnecessary data
- Data validation
- Standardizing values
- Identifying errors
- Preparing datasets
- Data transformation
Students understand why data preparation is one of the most important stages of analytics.
Module 6: SQL and Database Fundamentals
Databases are commonly used by organizations to store and manage large amounts of information.
Students are introduced to:
- Database fundamentals
- Tables
- Rows and columns
- Primary keys
- Relationships
- SQL fundamentals
- SELECT statements
- WHERE conditions
- Sorting
- Filtering
- GROUP BY
- Aggregate functions
- JOIN concepts
- Data retrieval
SQL knowledge can help analysts access and analyze data stored in databases.
Module 7: Data Visualization
Data visualization helps transform complex datasets into understandable visual information.
Students learn about:
- Importance of visualization
- Charts
- Graphs
- Bar charts
- Line charts
- Pie charts
- Area charts
- Scatter plots
- Tables
- Dashboard principles
- Visual storytelling
- Choosing the right chart
The goal is to help learners present data in a clear and meaningful way.
Module 8: Power BI for Data Analytics
Power BI is a popular business intelligence and data visualization platform.
Students can learn:
- Power BI fundamentals
- Data import
- Data transformation
- Data modeling
- Relationships
- Measures
- Calculations
- Charts
- Filters
- Slicers
- Interactive dashboards
- Reports
- Dashboard design
- Data visualization
- Publishing and sharing concepts
Students learn how to convert datasets into interactive business dashboards.
Module 9: Data Analysis with Python
Python is widely used for data analysis and automation.
Students can be introduced to Python concepts such as:
- Python fundamentals
- Variables
- Data types
- Operators
- Conditional statements
- Loops
- Functions
- Lists
- Dictionaries
- Basic file handling
The focus can then move toward data analysis concepts using relevant Python libraries.
Module 10: Python Libraries for Data Analytics
Python provides several libraries that can support data analytics workflows.
Students can be introduced to libraries such as:
NumPy
Used for numerical operations and working with arrays.
Pandas
Used for data manipulation, cleaning, filtering, grouping, and analysis.
Matplotlib
Used for creating charts and visualizations.
Seaborn
Used for statistical data visualization.
Students can understand how these libraries can support analytical workflows.
Module 11: Statistics for Data Analytics
Statistics provides important concepts for understanding and interpreting data.
Students learn fundamentals such as:
- Mean
- Median
- Mode
- Range
- Variance
- Standard deviation
- Percentages
- Ratios
- Distribution
- Correlation
- Basic probability
- Sampling
- Data interpretation
The goal is to help learners understand the meaning behind numerical information.
Module 12: Business Intelligence
Business Intelligence focuses on using data to support business decisions.
Students learn:
- Business intelligence fundamentals
- KPIs
- Business metrics
- Performance measurement
- Dashboard reporting
- Business reporting
- Data-driven decision-making
- Trend analysis
- Comparative analysis
- Business insights
Students understand how analytics can support managers and decision-makers.
Module 13: AI Fundamentals for Data Analytics
Artificial Intelligence is becoming increasingly important in data-related fields.
Students learn the fundamentals of:
- Artificial Intelligence
- Machine learning concepts
- Generative AI
- AI-assisted data analysis
- Pattern recognition
- Automation
- AI-powered insights
- Predictive analytics fundamentals
The module helps learners understand where AI fits into the modern analytics ecosystem.
Module 14: AI-Assisted Data Analysis
AI tools can support analysts in several stages of the data analysis process.
Students can learn how AI can assist with:
- Data exploration
- Identifying patterns
- Generating analytical questions
- Data summaries
- Formula assistance
- Query assistance
- Report generation
- Insight generation
- Data interpretation
- Visualization ideas
- Analytical documentation
AI output should be reviewed and validated against the original data to ensure accuracy.
Module 15: Predictive Analytics Fundamentals
Predictive analytics uses historical data to identify possible future trends and outcomes.
Students are introduced to:
- Predictive analytics
- Historical data
- Trend analysis
- Forecasting fundamentals
- Business forecasting
- Predictive models
- Risk analysis
- Customer behavior prediction
- Sales forecasting
The objective is to help learners understand how businesses can use data to prepare for possible future outcomes.
Module 16: Data Dashboards and Reporting
Businesses need reports that are easy to understand and useful for decision-making.
Students learn:
- Dashboard design
- KPI reporting
- Business reports
- Interactive dashboards
- Data storytelling
- Visual presentation
- Report structure
- Performance monitoring
- Management reporting
Students learn how to present analytical results to non-technical users.
Module 17: Marketing Analytics
Marketing generates a large amount of data that can be analyzed to measure campaign performance.
Students learn how analytics can be applied to:
- Website traffic
- Social media performance
- Advertising campaigns
- Lead generation
- Customer acquisition
- Conversion rates
- Marketing costs
- Customer behavior
- Campaign performance
- Marketing ROI
This knowledge can be useful for professionals working in digital marketing and business analytics.
Module 18: Sales Analytics
Sales data can provide important insights into business performance.
Students learn about:
- Sales performance
- Revenue analysis
- Product performance
- Customer analysis
- Sales trends
- Conversion rates
- Sales targets
- Regional performance
- Sales forecasting
- Customer segmentation
This helps organizations identify areas of growth and improvement.
Module 19: Financial Analytics Fundamentals
Financial data is another important area of business analytics.
Students can analyze:
- Revenue
- Expenses
- Profit
- Costs
- Budgets
- Cash flow
- Financial performance
- Financial trends
- Business profitability
The focus is on understanding financial information from an analytical perspective.
Module 20: Data Privacy and Security
Working with data requires responsible handling of information.
Students learn the fundamentals of:
- Data privacy
- Data security
- Sensitive information
- Access control
- Responsible data usage
- Data protection
- Ethical data practices
- Secure data handling
The objective is to help learners understand that data should be handled responsibly and securely.
Skills You Can Develop
After completing the Diploma in Data Analytics with AI, learners can develop skills in:
- Data analysis
- Data cleaning
- Data preparation
- Excel
- Advanced Excel
- SQL
- Database fundamentals
- Power BI
- Data visualization
- Dashboard creation
- Python fundamentals
- Python data analytics
- Statistics
- Business intelligence
- Reporting
- Data interpretation
- AI-assisted analytics
- Predictive analytics fundamentals
- Business decision-making
- Analytical thinking
- Problem-solving
Career Opportunities After Data Analytics with AI
Data analytics is used across many industries. Depending on qualifications, skills, experience, and employer requirements, learners may explore roles such as:
Data Analyst
Data Analysts collect, clean, analyze, and interpret data to help organizations make informed decisions.
Business Analyst
Business Analysts study business requirements, processes, and data to help organizations improve operations and decision-making.
Data Analytics Executive
Data Analytics Executives support data analysis, reporting, dashboards, and business intelligence activities.
MIS Executive
MIS professionals prepare reports, maintain business information, analyze operational data, and support management reporting.
Reporting Analyst
Reporting Analysts create regular and customized reports that help organizations monitor performance.
Business Intelligence Analyst
Business Intelligence professionals use data, dashboards, and analytical tools to provide business insights.
Data Visualization Analyst
These professionals focus on presenting data through charts, dashboards, and visual reports.
Marketing Data Analyst
Marketing analysts study campaign, customer, website, and advertising data to measure marketing performance.
Sales Analyst
Sales analysts examine sales data, revenue, targets, customer performance, and trends.
Industries Where Data Analytics is Used
Data analytics is relevant across almost every major industry.
Career opportunities can be explored in:
- Information Technology
- Banking
- Financial Services
- E-commerce
- Retail
- Healthcare
- Education
- Manufacturing
- Logistics
- Telecommunications
- Marketing
- Real Estate
- Hospitality
- Insurance
- Consulting
- Media
- Startups
- Government and public services
The specific role and responsibilities depend on the organization and the candidate’s qualifications and experience.
Data Analytics for Working Professionals
Data analytics skills can be valuable for professionals from different departments.
For example:
A marketing professional can use analytics to measure campaign performance.
A sales professional can analyze revenue and customer trends.
An HR professional can analyze employee information.
A finance professional can analyze business performance.
An operations professional can monitor productivity and process performance.
Learning analytics can therefore help professionals become more data-driven in their existing roles.
Data Analytics for Entrepreneurs
Business owners can also benefit from data analytics.
Analytics can help entrepreneurs understand:
- Sales performance
- Customer behavior
- Marketing results
- Product performance
- Revenue trends
- Business expenses
- Customer retention
- Operational performance
Instead of making decisions based only on assumptions, entrepreneurs can use data to identify trends and opportunities.
Practical Learning Approach
Data analytics is a practical field, and students need hands-on experience to develop confidence.
At SRC Education, learners can work on practical activities such as:
- Spreadsheet exercises
- Data cleaning
- Data analysis
- SQL exercises
- Dashboard development
- Power BI projects
- Data visualization
- Python exercises
- Business case studies
- Reporting projects
- AI-assisted analytics
- Business datasets
Project-based learning can help students understand how analytics is used in real business environments.
Why Choose SRC Education?
Career-Oriented Curriculum
The program covers essential data analytics concepts along with modern AI applications.
Practical Training
Students can work on exercises, datasets, dashboards, reports, and analytical projects.
AI Integration
The course introduces the role of Artificial Intelligence in modern data analytics.
Multiple Tools
Learners can gain exposure to important tools and technologies used in data analysis.
Business-Focused Learning
Students learn how analytics can be applied to marketing, sales, finance, operations, and other business functions.
Professional Skill Development
Along with technical skills, learners can develop analytical thinking, communication, reporting, and problem-solving abilities.
Frequently Asked Questions
What is a Diploma in Data Analytics with AI?
It is a professional program that combines data analytics concepts and tools with Artificial Intelligence applications to help learners develop modern analytical skills.
What will I learn in this course?
You can learn Excel, Advanced Excel, SQL, Power BI, data visualization, Python fundamentals, statistics, business intelligence, reporting, AI-assisted analytics, and predictive analytics fundamentals.
Is Data Analytics a good career option?
Data analytics is used across many industries because organizations increasingly rely on data for decision-making. Career opportunities depend on skills, qualifications, experience, and market requirements.
Can beginners learn Data Analytics?
Yes. Beginners can start with basic data concepts and gradually learn spreadsheets, databases, visualization, analytics tools, and programming.
Do I need programming knowledge?
Programming is not necessarily required to begin learning data analytics. However, Python and SQL can expand your analytical capabilities and are valuable skills for many analytics roles.
Is Excel important for Data Analytics?
Yes. Excel remains widely used for business reporting, data organization, analysis, and visualization.
Why is Power BI included in Data Analytics?
Power BI helps professionals transform data into interactive reports and dashboards that can support business decision-making.
How is AI used in Data Analytics?
AI can assist with data exploration, summaries, pattern identification, automation, forecasting assistance, reporting, and other analytical workflows.
Can I work in Data Analytics after completing this course?
The course can help you develop skills relevant to entry-level analytics and reporting roles. Employment depends on your overall qualifications, practical skills, projects, experience, and employer requirements.
Can working professionals join this course?
Yes. Working professionals from marketing, sales, finance, HR, operations, and other fields can use data analytics skills to improve their reporting and decision-making capabilities.
Build Your Future with Data Analytics and AI
Data is one of the most valuable resources for modern organizations. Companies use data to understand customers, measure performance, identify opportunities, improve operations, and make informed decisions.
At the same time, Artificial Intelligence is changing the way professionals work with data by providing new ways to explore information, automate tasks, identify patterns, and generate insights.
The Diploma in Data Analytics with AI is designed to help learners understand both the fundamentals of data analytics and the growing role of AI in modern analytical workflows.
Whether you want to begin a career in data analytics, improve your current professional skills, support your business with data, or develop a strong foundation for advanced analytics, this program can help you take the next step.
Start Learning Data Analytics with AI
Build your analytical thinking, technical knowledge, visualization skills, business understanding, and AI-assisted analytics capabilities with SRC Education.
Learn Data. Understand Insights. Make Better Decisions.
Contact SRC Education to learn more about the Diploma in Data Analytics with AI, eligibility, duration, fees, batch timings, and admission process.