For Enquire Call us : 9811631557
POWER BI
Power BI Course – Data Visualization & Business Intelligence
Learn Power BI with Practical Training at SRC Education
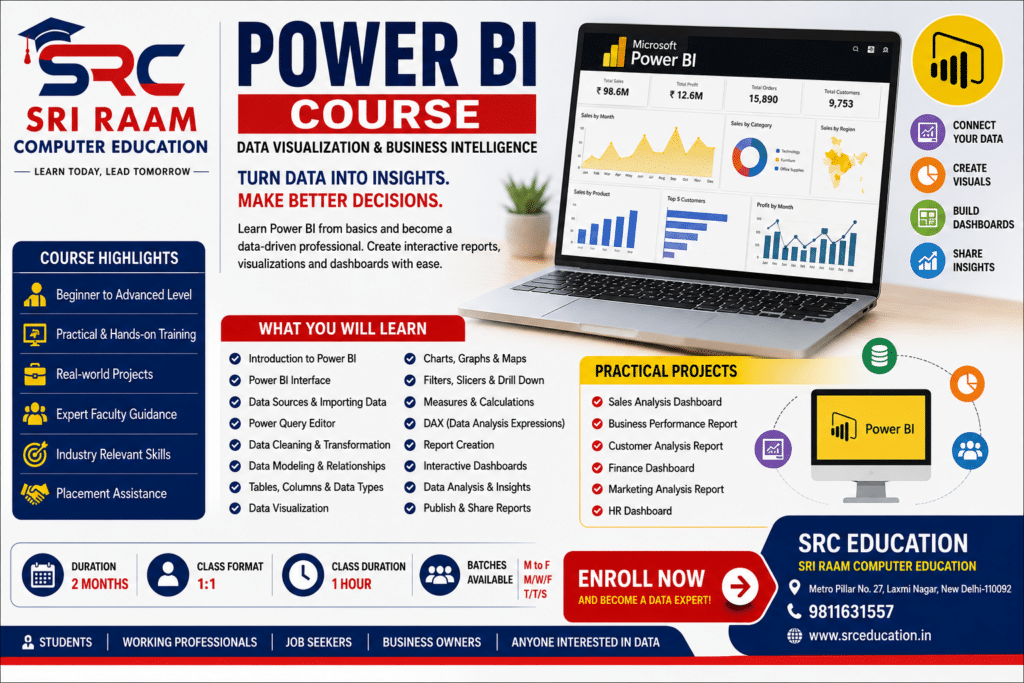
Power BI Course at SRC Education – Sri Raam Computer Education is designed for students, working professionals, job seekers, business owners, and beginners who want to learn how to work with data and create meaningful reports and dashboards.
In today’s data-driven environment, organizations generate large amounts of information every day. The ability to organize this information, analyze it, and present it in an understandable format is an important skill. Microsoft Power BI helps users transform raw data into interactive reports, visualizations, and dashboards.
At SRC Education, the Power BI course focuses on practical learning. Students learn how to import data, clean and transform it, organize data, create visualizations, build reports, use filters and slicers, and develop interactive dashboards.
The course is suitable for learners who want to develop practical data analysis and business intelligence skills without starting with complicated programming.
What is Power BI?
Microsoft Power BI is a business intelligence and data visualization platform used to connect with data, analyze information, create interactive reports, and present insights through dashboards.
Power BI can work with different types of data sources and allows users to convert raw information into meaningful visual reports.
For example, a company may have sales data containing thousands of records. Instead of manually studying every row, Power BI can help create charts and dashboards showing:
- Total sales
- Monthly sales
- Product performance
- Sales by location
- Customer information
- Revenue trends
- Performance comparisons
This makes it easier to understand data and support better decision-making.
Power BI Course at SRC Education
The Power BI course at SRC Education focuses on developing practical skills required to work with data and create professional-looking reports.
Students are introduced to the Power BI environment and gradually learn different stages of the data analysis process.
The training covers the complete basic workflow:
Connect Data → Clean Data → Transform Data → Model Data → Create Visualizations → Build Reports → Create Dashboards → Analyze Insights
Students get opportunities to practice with data and understand how different Power BI features work.
Power BI Course Modules
The course covers important Power BI concepts and practical skills, including:
- Introduction to Power BI
- Power BI Interface
- Data Sources
- Importing Data
- Data Cleaning
- Power Query
- Data Transformation
- Data Modeling
- Relationships
- Tables and Columns
- Data Visualization
- Charts and Graphs
- Filters and Slicers
- Measures
- DAX Basics
- Report Creation
- Interactive Dashboards
- Data Analysis
- Report Formatting
- Practical Projects
1. Introduction to Power BI
The course starts with an introduction to Power BI and Business Intelligence.
Students learn what Power BI is, why organizations use data visualization, and how raw data can be converted into useful information.
The basic Power BI ecosystem and its purpose are explained in a simple manner so that beginners can understand how the software is used.
Topics Include:
- Introduction to Business Intelligence
- Introduction to Power BI
- Importance of data analysis
- Data visualization
- Power BI applications
- Power BI workflow
- Basic Power BI terminology
This foundation helps learners understand the purpose of Power BI before moving to practical activities.
2. Power BI Interface
Students are introduced to the Power BI working environment and its different sections.
Understanding the interface is important because Power BI contains several tools and options for importing data, transforming data, creating reports, and analyzing information.
Students learn how to navigate the Power BI interface and understand the basic purpose of different areas.
The training is designed to help beginners become comfortable with the software before starting report development.
3. Connecting and Importing Data
One of the most important steps in Power BI is bringing data into the application.
Power BI can work with data from different sources. Students learn the basic process of connecting to and importing data.
Data Sources May Include:
- Excel files
- CSV files
- Text files
- Databases
- Other supported data sources
Students learn how to select an appropriate data source and bring information into Power BI for further processing and analysis.
4. Data Cleaning and Preparation
Raw data is not always ready for analysis. It may contain blank values, duplicate records, incorrect formats, unnecessary columns, or inconsistent information.
Power BI provides tools for preparing data before creating reports.
Students learn the importance of data cleaning and understand how properly prepared data can improve the quality of analysis.
Basic Data Preparation Includes:
- Removing unnecessary columns
- Managing rows
- Handling blank values
- Removing duplicates
- Changing data types
- Renaming columns
- Formatting data
- Preparing data for analysis
The objective is to help students understand why clean and organized data is important.
5. Power Query
Power Query is an important part of Power BI used for connecting to data and transforming it.
Students are introduced to Power Query and learn how it can be used to prepare data before analysis.
Topics Include:
- Introduction to Power Query
- Query Editor
- Data transformation
- Changing data types
- Removing columns
- Filtering data
- Removing duplicates
- Splitting columns
- Merging data
- Basic transformation steps
Students learn how multiple transformation steps can be applied to prepare data for reporting.
6. Data Transformation
Data transformation is an important stage in the Power BI workflow.
Students learn how raw information can be modified into a more organized structure that is suitable for analysis.
For example, information may need to be separated, combined, filtered, renamed, or converted into the correct format.
Understanding data transformation helps learners prepare better datasets and create more reliable reports.
7. Data Modeling
Once data is prepared, the next important step is understanding how different tables and datasets work together.
Students are introduced to the basic concepts of data modeling in Power BI.
Topics Include:
- Tables
- Columns
- Data relationships
- Primary and related fields
- Basic data model structure
- Relationships between tables
A properly organized data model helps Power BI generate accurate reports and calculations.
Students learn how different tables can be connected so that information can be analyzed together.
8. Relationships Between Tables
Power BI reports may use information from multiple tables.
Students learn the importance of creating relationships between related tables and understand how relationships allow data to work together.
For example, a sales dataset may contain sales information while another table contains product details. Connecting related information allows users to analyze sales based on different product categories.
Students learn the basic concepts required to work with related tables.
9. Data Visualization
Data visualization is one of the main features of Power BI.
Instead of presenting information only in rows and columns, Power BI allows users to represent data using charts, graphs, cards, tables, and other visuals.
Students learn how to select appropriate visualizations according to the type of information they want to present.
Common Visualizations Include:
- Bar charts
- Column charts
- Line charts
- Pie charts
- Donut charts
- Tables
- Matrix
- Cards
- Maps
- Other Power BI visuals
The goal is to make data easier to understand.
10. Creating Charts and Graphs
Students learn how to create different types of charts and use them to represent information.
For example, a column chart can be used to compare sales between products, while a line chart can show changes over time.
Learners understand that selecting the right visual is important for presenting information clearly.
They also learn basic formatting options to make charts more readable.
11. Filters and Slicers
Power BI reports become more interactive when users can filter information according to their requirements.
Students learn how filters and slicers can be used to view specific portions of data.
For example, a sales dashboard may allow a user to select:
- Month
- Year
- Product
- Location
- Category
The report can then display the selected information.
Slicers are particularly useful for creating interactive dashboards.
12. Cards and Key Performance Information
Cards can be used to display important values in a Power BI report.
For example, a dashboard may display:
- Total Sales
- Total Orders
- Total Customers
- Total Profit
- Average Sales
Students learn how key information can be highlighted using appropriate visuals.
This helps users quickly understand important business figures without studying the complete dataset.
13. Measures and Calculations
Power BI allows users to create calculations for analyzing data.
Students are introduced to the concept of measures and understand how calculated values can be used in reports.
Measures can help calculate information such as totals, averages, counts, and other business-related values.
The focus is on practical calculations required for creating useful reports and dashboards.
14. Introduction to DAX
DAX (Data Analysis Expressions) is the formula language used in Power BI for creating calculations and measures.
The course introduces learners to the basic concepts of DAX.
Students learn how DAX can be used to perform calculations and create meaningful metrics.
Basic DAX Concepts Include:
- Introduction to DAX
- Measures
- Basic calculations
- Aggregation functions
- Simple logical calculations
- Using calculations in reports
The objective is to provide a practical foundation in DAX rather than overwhelming beginners with complex formulas.
15. Creating Interactive Reports
Students learn how to combine different visuals and data elements to create interactive Power BI reports.
A report can contain multiple visuals that work together to provide different views of the same dataset.
Students learn how to arrange visuals logically and create reports that are easy to understand.
16. Dashboard Creation
Dashboard creation is one of the key practical areas of Power BI training.
Students learn how to bring important information together into a single visual interface.
A dashboard can provide an overview of business performance using charts, cards, tables, filters, and other visuals.
Dashboard Examples
- Sales Dashboard
- Business Performance Dashboard
- Financial Dashboard
- Student Performance Dashboard
- Customer Analysis Dashboard
- Marketing Dashboard
- HR Dashboard
Students learn how to organize information so that important insights can be understood quickly.
17. Report Formatting
A good report should not only contain correct information but should also be easy to read.
Students learn basic formatting techniques for improving the appearance and readability of reports.
Formatting Areas Include:
- Visual arrangement
- Titles
- Labels
- Text
- Tables
- Charts
- Filters
- Slicers
- Report layout
The objective is to create clean and understandable reports.
18. Data Analysis with Power BI
Power BI is not only about creating attractive charts. It also helps users analyze information and identify useful patterns.
Students learn how visual reports can help answer questions such as:
- Which product is performing better?
- Which month has higher sales?
- Which location generates more revenue?
- What are the sales trends?
- Which category has better performance?
- How are results changing over time?
This analytical approach helps learners understand the practical value of Business Intelligence.
19. Practical Power BI Projects
Practical projects are an important part of learning Power BI.
Students can work with sample datasets and create complete reports based on real-world scenarios.
Possible Projects Include:
Sales Analysis Dashboard
Analyze sales based on products, locations, customers, and time periods.
Business Performance Dashboard
Present important business metrics using interactive visuals.
Customer Analysis
Analyze customer-related information and identify useful patterns.
Student Performance Dashboard
Represent student-related information using charts and interactive filters.
Marketing Analysis
Analyze marketing-related data and present performance through visual reports.
Projects help learners connect individual Power BI features and understand the complete reporting workflow.
Skills You Will Learn in Power BI
After completing Power BI training, learners can develop practical skills in:
- Power BI fundamentals
- Business Intelligence basics
- Data importing
- Data preparation
- Data cleaning
- Power Query
- Data transformation
- Data modeling
- Table relationships
- Data visualization
- Charts and graphs
- Filters
- Slicers
- Cards
- Measures
- Basic DAX
- Report creation
- Dashboard creation
- Report formatting
- Data analysis
- Practical dashboard projects
Who Can Join the Power BI Course?
The Power BI course can be useful for learners from different backgrounds.
Suitable For:
- Students
- College graduates
- Job seekers
- Working professionals
- Business owners
- Data beginners
- Excel users
- MIS professionals
- Sales professionals
- Marketing professionals
- HR professionals
- Finance professionals
- Individuals interested in Data Analytics
Basic familiarity with computers and spreadsheets can be helpful, but the course is structured to introduce Power BI concepts step by step.
Why Learn Power BI?
Data is used across almost every modern organization. Companies need people who can organize information and present it in a way that is easy to understand.
Power BI provides a practical way to turn data into visual reports and dashboards.
Learning Power BI can help learners develop an important data visualization skill and understand how businesses use data to monitor performance and make informed decisions.
For learners interested in Data Analytics, MIS, Business Intelligence, or reporting, Power BI can be a valuable skill to add to their existing knowledge.
Why Choose SRC Education for Power BI Training?
Practical Learning
SRC Education focuses on practical understanding so that learners can practice Power BI concepts instead of only studying theory.
Structured Training
The course follows a step-by-step approach, beginning with Power BI fundamentals and moving toward data preparation, visualization, reporting, and dashboards.
Project-Based Practice
Students can work on practical datasets and create dashboards to understand how Power BI is used in real-world scenarios.
Beginner-Friendly Approach
The concepts are explained from the basics so learners can gradually develop their confidence.
Data Visualization Focus
The course focuses on transforming raw information into meaningful charts, reports, and dashboards.
Career Areas After Learning Power BI
Power BI skills can be useful in different data and reporting-related roles.
Depending on a learner’s overall education, experience, and additional skills, Power BI knowledge can support career paths such as:
- Power BI Developer
- Data Analyst
- Business Intelligence Analyst
- Reporting Analyst
- MIS Executive
- Business Analyst
- Data Visualization Professional
- Dashboard Developer
Power BI is often used alongside other skills such as Excel, SQL, statistics, data analysis, and business understanding. Therefore, learners can continue developing their skills after completing Power BI training.
Power BI Course in Laxmi Nagar
If you are looking for a Power BI course in Laxmi Nagar, SRC Education – Sri Raam Computer Education provides practical training focused on data visualization, reporting, dashboards, and business intelligence concepts.
Students learn how to work with data from the beginning and gradually move toward creating interactive reports and dashboards.
The course can be useful for students, job seekers, working professionals, and anyone interested in developing data-related skills.
Power BI Course Highlights
| Course Feature | Details |
|---|---|
| Course | Power BI |
| Institute | SRC Education – Sri Raam Computer Education |
| Level | Beginner to Practical |
| Focus | Data Visualization & Business Intelligence |
| Data Preparation | Yes |
| Power Query | Yes |
| Data Modeling | Yes |
| Data Visualization | Yes |
| DAX Basics | Yes |
| Reports | Yes |
| Dashboards | Yes |
| Practical Projects | Yes |
Frequently Asked Questions – Power BI Course
What is Power BI?
Power BI is a Microsoft Business Intelligence and data visualization platform used to connect, analyze, and present data through interactive reports and dashboards.
Is Power BI suitable for beginners?
Yes. Beginners can learn Power BI by starting with basic data importing, cleaning, visualization, and report creation.
What will I learn in the Power BI course?
You will learn data importing, Power Query, data cleaning, transformation, data modeling, relationships, visualizations, filters, slicers, measures, basic DAX, reports, dashboards, and practical projects.
Is Excel knowledge required?
Advanced Excel knowledge is not compulsory, but basic spreadsheet knowledge can make learning Power BI easier.
Does the course include Power Query?
Yes. Power Query and basic data transformation are included.
Does the course include DAX?
Yes. The course introduces the basics of DAX and practical calculations used in Power BI reports.
Will I learn dashboard creation?
Yes. Dashboard and interactive report creation are important parts of the training.
Is Power BI useful for Data Analytics?
Yes. Power BI is widely used for data visualization, reporting, and Business Intelligence workflows.
Is Power BI useful for MIS?
Yes. Power BI can be useful for creating interactive reports and dashboards and can complement Excel and other MIS-related skills.
Enroll for Power BI Training at SRC Education
The Power BI Course at SRC Education – Sri Raam Computer Education is designed to help learners develop practical data visualization and Business Intelligence skills.
From importing and cleaning data to creating visualizations, working with Power Query, understanding data relationships, creating measures, learning basic DAX, building reports, and designing interactive dashboards, the course covers the important stages of working with Power BI.
Whether you are a student, job seeker, Excel user, working professional, or someone interested in Data Analytics, learning Power BI can help you build a useful data-related skill.
Start learning Power BI with SRC Education and learn how to transform data into meaningful reports, visualizations, and interactive dashboards.
SRC Education – Sri Raam Computer Education
Power BI Training | Data Visualization | Business Intelligence
Learn Data. Create Reports. Build Interactive Dashboards.